Example engagements
Six scenarios, with the assumptions showing
Representative projects built from typical deployment parameters: the site, the constraints, the hardware and the timeline, with modeled results you can check against your own numbers.

Example engagement — a representative scenario built from typical deployment parameters. Figures are modeled, not reported results from a named client.
How to read these
Built from typical parameters, not borrowed from a client
Each example describes a kind of site we design for: a snack line, a stamping plant, a molding cell, a critical-power campus, a corrugator and a distribution center. The line speeds, asset counts, environments and IT rules are typical of that kind of site. None of them is a specific plant, and no client's name, data or results appear in them.
The results are modeled. We start from a baseline that is typical for the scenario (a leak-test log, a scrap tally, a downtime history, a utility bill), apply the detection and response the system would provide, and print the assumptions next to the number. Change an assumption and the number moves. That is the point of showing them.
Why publish modeled numbers at all? A case study with a logo tells you a result happened somewhere. It rarely tells you what had to be true for it to happen, or whether those things are true on your line. We would rather show the mechanism and the arithmetic, then measure your site properly. Every real engagement starts with a Feasibility Sprint or a Proof of Value that sets a baseline, and ends with the same measurement.
Anatomy of an example
What each scenario walks through
- The situation — the site, the product or asset, and what goes wrong today
- The constraints — line speed, environment, IT/OT rules, shifts and change control
- The approach — from Feasibility Sprint to deployment, with durations and published prices
- What the system does — sensors, models, integration and alerts
- Modeled results — the assumptions that produce them, and what they leave out
- Phase two — what we would watch next, including the blind spots of phase one
The six scenarios
Pick the one closest to your site
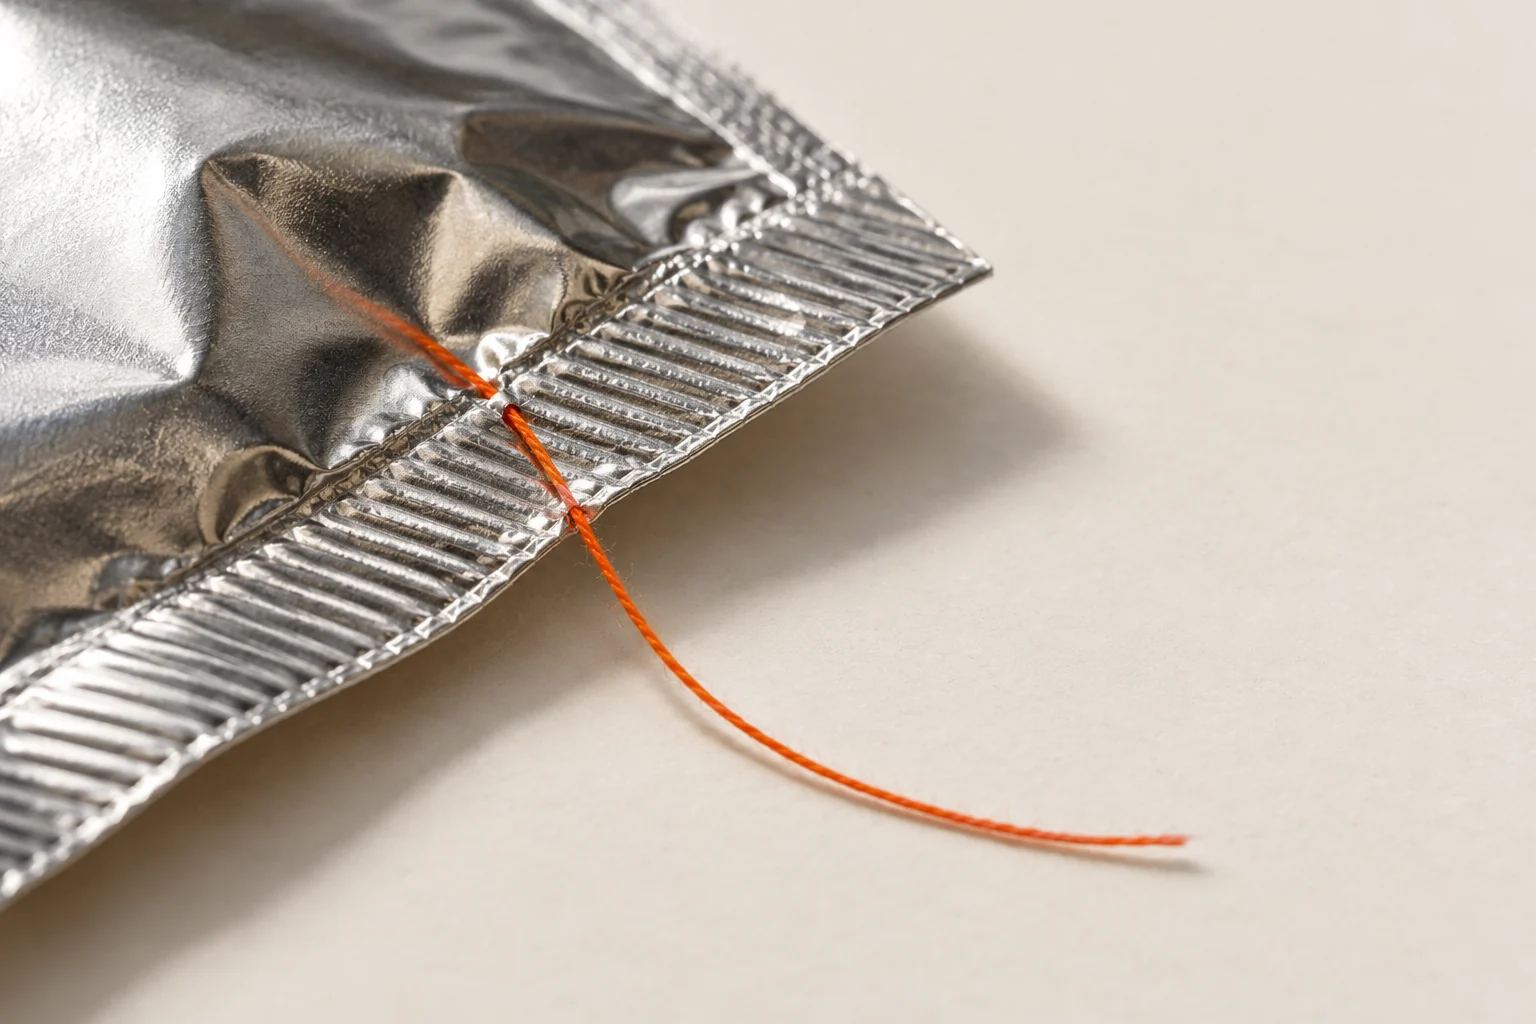
Heat-seal inspection at 180 packs per minute
Low-angle red light on metallized film reveals the trapped crumbs and pleats behind most leaking seals, and a Gatepoint G2 rejects the pack.
Read more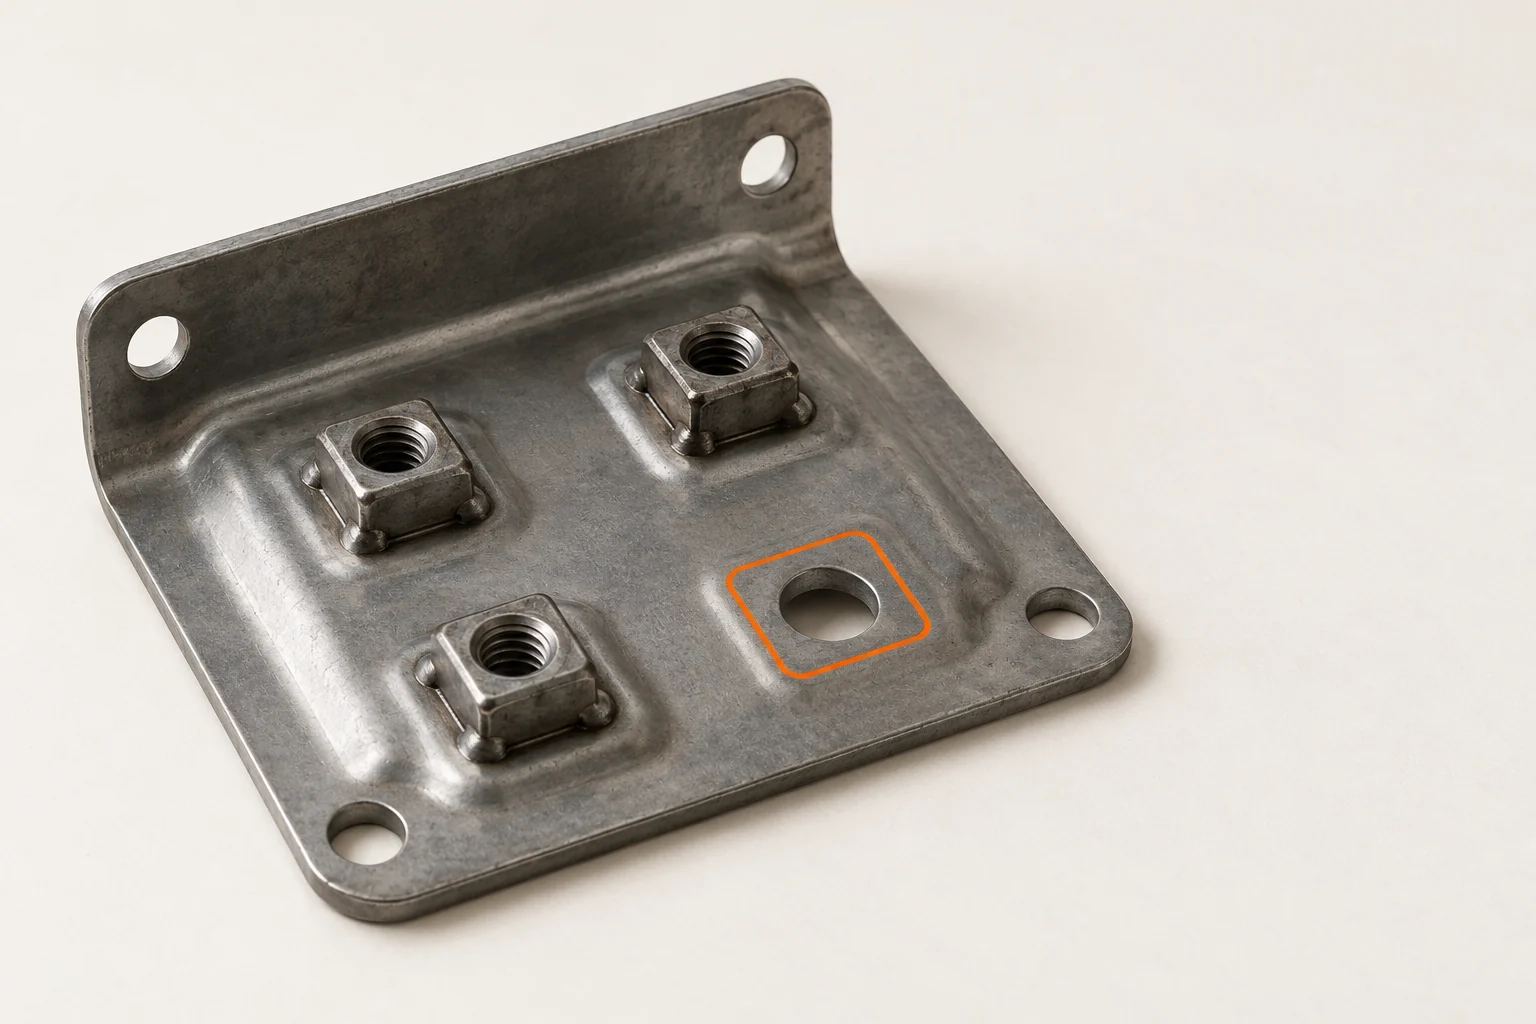
Weld-nut verification on existing cameras
Six cameras a stamping plant already owns, a new model and a PLC handshake with a heartbeat stop brackets shipping without their nuts.
Read more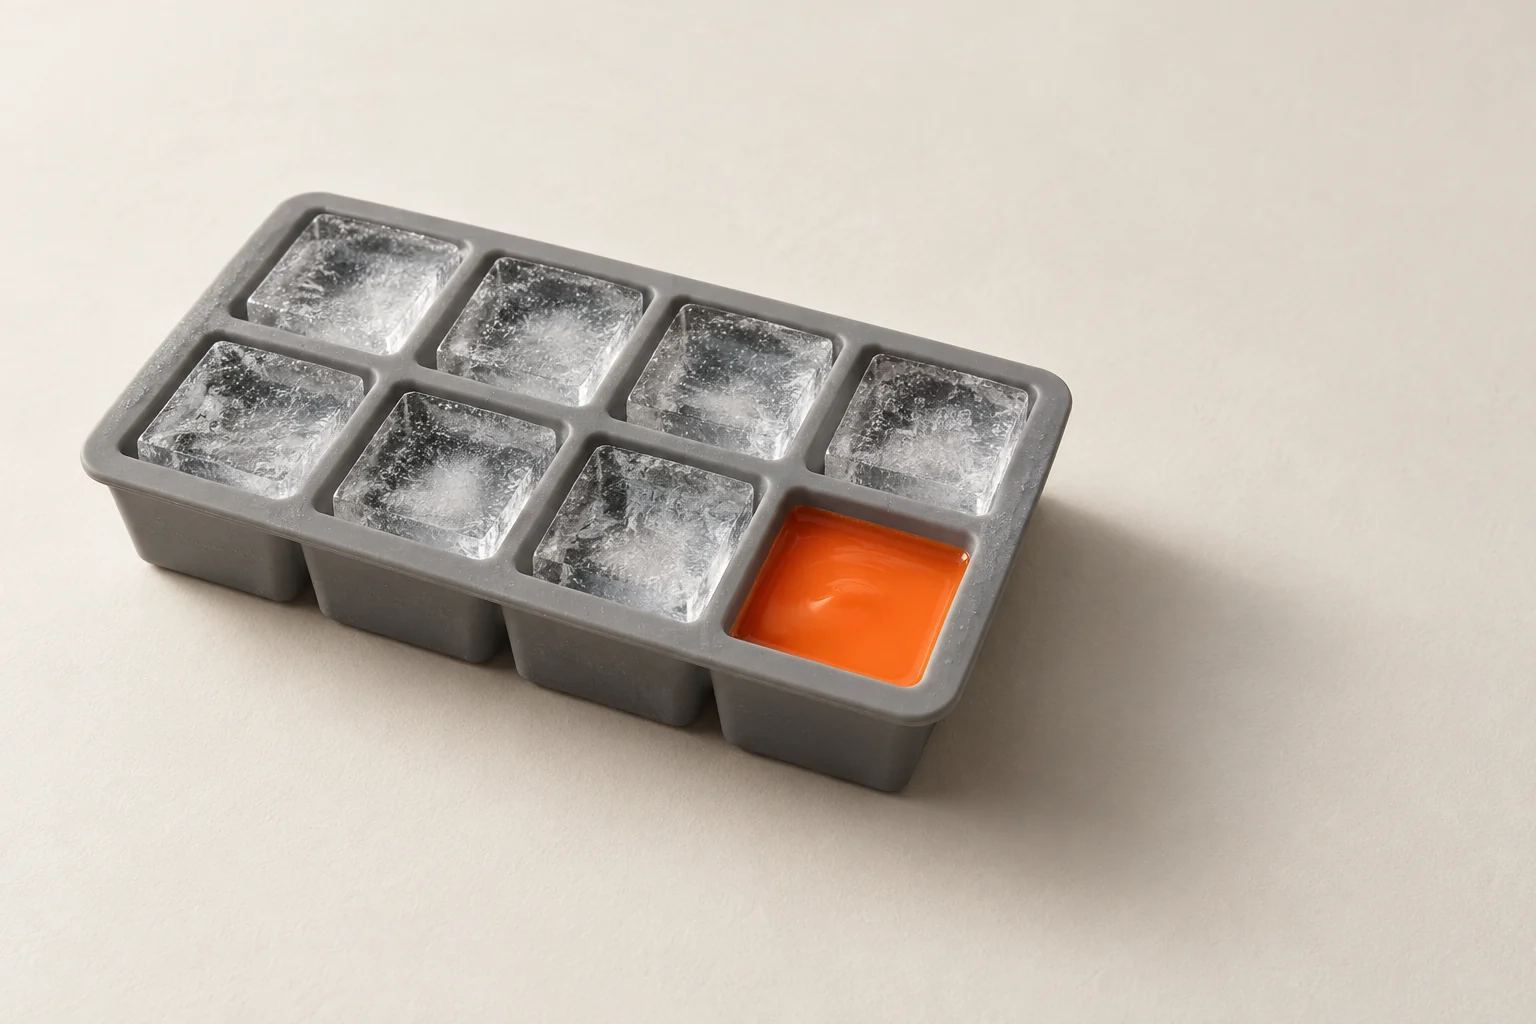
Per-cavity thermal watch on a 16-cavity mold
A Lensnode T reads all 16 cavities at every mold-open and diverts the shot when one cavity drifts out of its thermal pattern.
Read more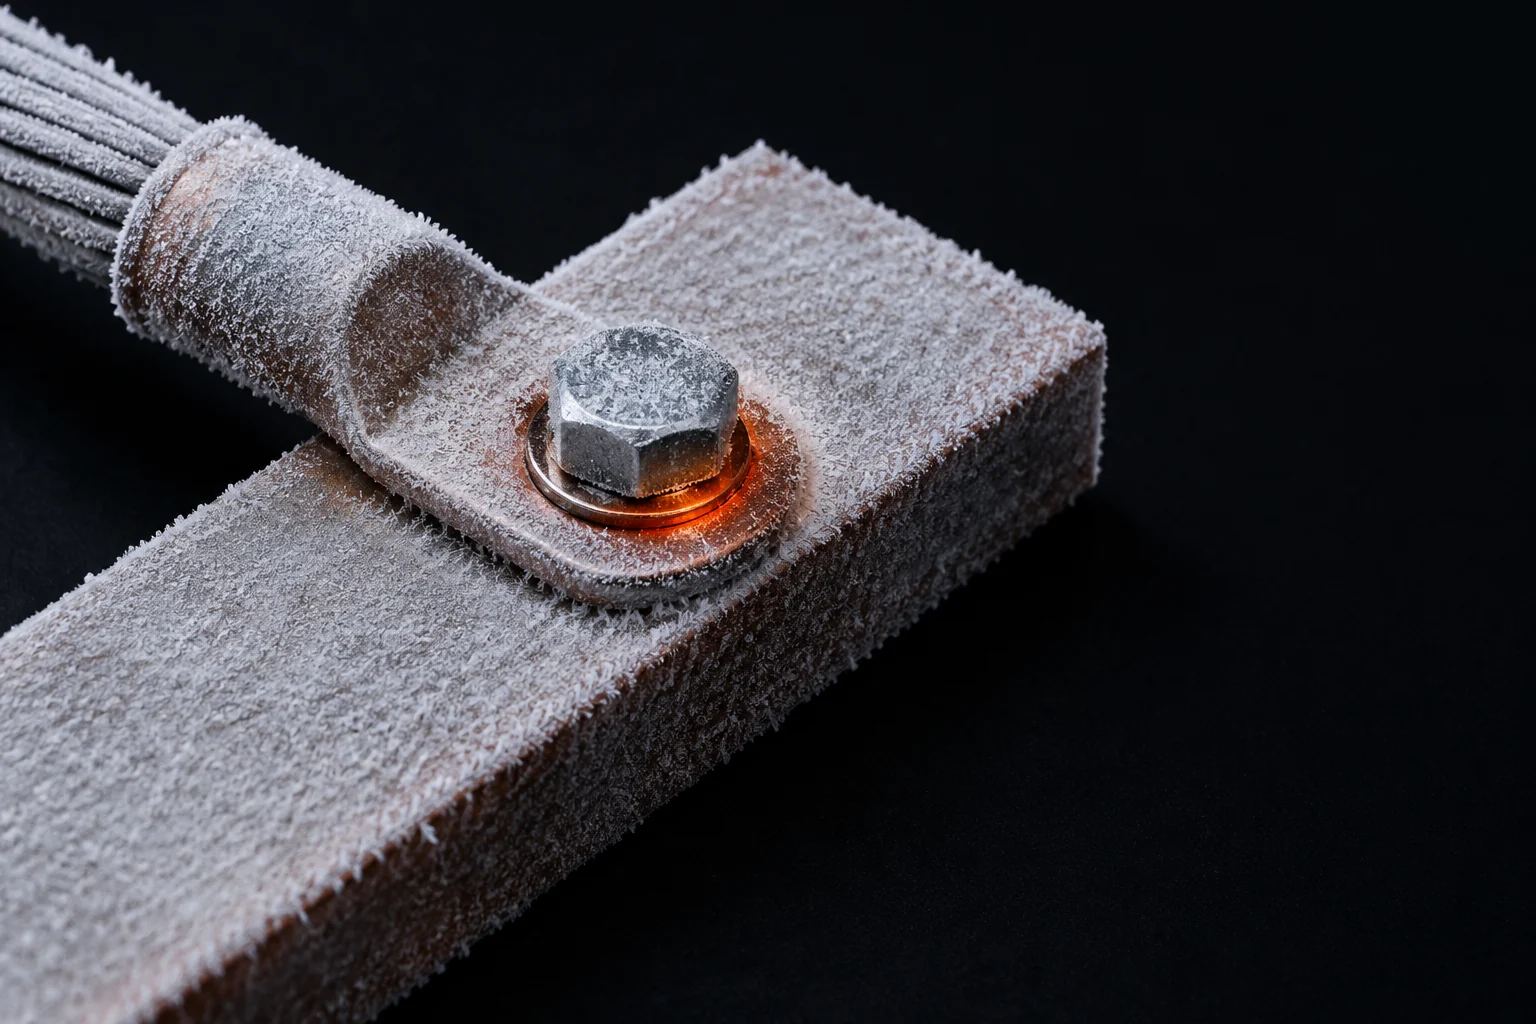
Continuous thermal on switchgear and BESS
Fixed thermal cameras behind IR windows and inside battery containers check bolted connections every minute, normalized for load.
Read more
Condition monitoring on 38 corrugator drives
Wireless Pulsenode W nodes and analyst-verified alerts cover the drives, gearboxes, blowers and pumps that can stop a box plant.
Read more
Compressed-air and energy monitoring
An ultrasound survey, permanent leak monitors and metered compressors find the air a distribution center loses while the sorter sleeps.
Read moreYour own scenario
How we would model your site instead
-
Discovery call
Tell us about the defect, the asset or the building, and what being wrong costs. We tell you which of these examples is closest and which numbers to gather.
-
Feasibility Sprint
Your samples, records or site data, studied by our engineers. You get a written go/no-go with a modeled ROI built on your baseline rather than a typical one.
-
Proof of Value
Six weeks on your line against success criteria agreed in writing. The modeled number becomes a measured one, or you learn it doesn't hold before you commit to a deployment.
Model your own scenario
Book a 45-minute discovery call. Bring the defect, the machine or the building and what it costs when things go wrong; we'll tell you which numbers to gather to model it properly.