Molds and cavities
Lensnode T measures each cavity's surface temperature every shot, flagging a hot or cold cavity before short shots or sink marks reach the box.
Vision & Inspection
Fixed radiometric thermal and multispectral sensors that watch your molds, seals and ovens on every cycle, and your switchgear, busbars and battery containers around the clock — with alarms built on temperature rise, not raw readings.
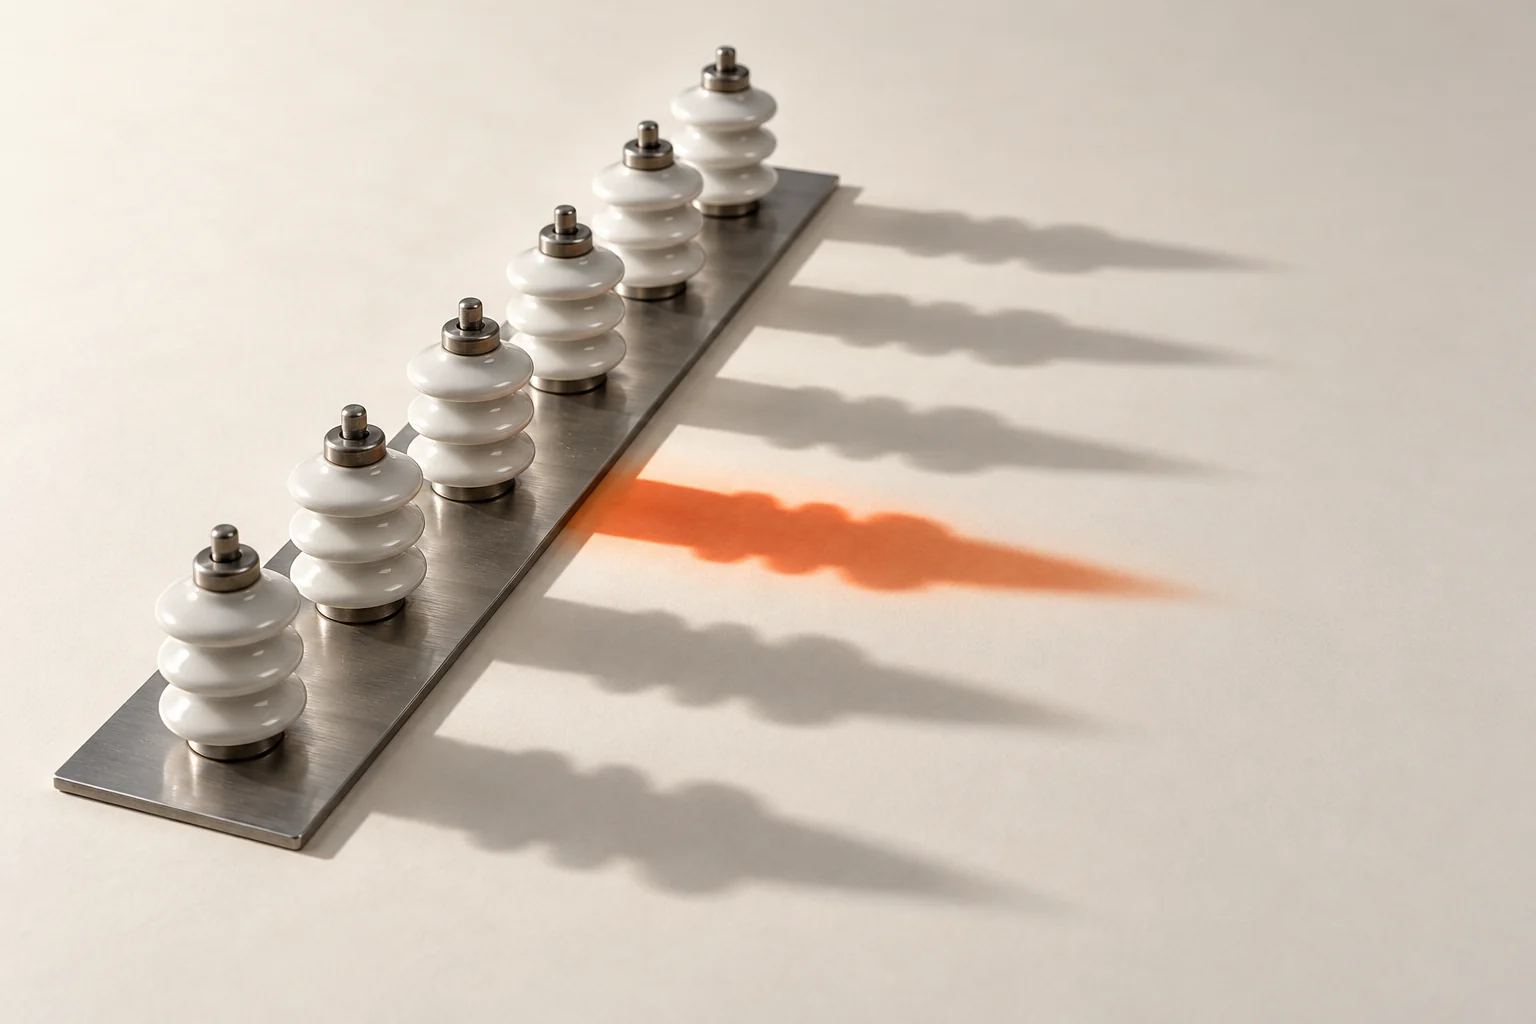
The problem
On a production line, heat is often the first sign of a defect. A mold cavity running a few degrees hot makes sink marks for a whole shift before a part is measured. A sealing jaw with a failing heater makes seals that look fine and peel in the warehouse.
On electrical equipment the stakes are higher. A loosening bolted connection heats roughly with the square of the current through it, so it can look harmless at 30% load on survey day and run dangerously hot at peak. An annual infrared survey sees one moment under whatever load happened to be on, usually with energized panels opened under arc-flash procedures.
Continuous monitoring records what happens between snapshots: the trend, the load at the time, and the moment something starts to drift.
Where it's used
Lensnode T measures each cavity's surface temperature every shot, flagging a hot or cold cavity before short shots or sink marks reach the box.
Seal jaws and weld seams are imaged as they leave the station; a cold seal or incomplete weld shows a profile out of family with its neighbors.
A profile across the belt width exposes dead burners, blocked nozzles and uneven drying before moisture or color goes out of specification.
Bolted joints, cable terminations and breaker connections watched continuously and trended against load.
Battery racks, container HVAC and yard equipment, analyzed on site by a Gatepoint XT rated from −40 to 70 °C.
Lensnode M captures 8 bands from visible to 1,000 nm, separating materials that look identical to a color camera — film from leaf, stone from kernel.
Continuous vs periodic
They answer different questions, so most programs we design use both — permanent sensors on the critical few, surveys on the rest. See our field note on continuous vs periodic IR surveys.
| What matters | Periodic IR survey | Continuous thermal monitoring |
|---|---|---|
| How often you see the asset | Once or twice a year | Every few seconds, every day |
| Load during measurement | Whatever the load was on survey day | Recorded with every reading, so rise can be compared at similar load |
| Panel access | Covers opened or IR windows used by a surveyor | Sensor stays in place; panels stay closed |
| Output | A report with images of exceptions | Trends, alarms and work orders |
| Best for | Many lower-criticality panels across a site | Critical connections, unmanned or hard-to-reach equipment, outdoor yards |
Measuring heat honestly
Bare copper and aluminum are poor emitters and good mirrors, so they read low and reflect nearby heat. We aim at insulation, oxidized surfaces or emissivity labels applied during an outage, and record the emissivity assumed for every region.
Long-wave infrared does not pass through ordinary glass or acrylic. IR windows use infrared-transmitting materials with their own transmission loss, which we measure and compensate.
Thresholds are set on rise over ambient and on the difference between sibling phases under the same load. A joint well above its two neighbors means more than one that is warm on a hot afternoon.
A Pulsenode C on the feeder supplies current, so temperature rise is compared at similar load.
Process
For process QC we image your samples in our optics lab. For electrical assets we review single-line diagrams and survey history, and propose the critical points worth watching.
Loaner sensors on one process station or a set of critical assets, against success criteria agreed in writing.
IR windows fitted during a planned outage, sensors commissioned, and a baseline recorded across normal load and ambient cycles.
Your engineer signs off the alarm logic; Perflens Care then reviews alarms and adjusts thresholds as the site changes.
Sensors
Honest fit
See it in context
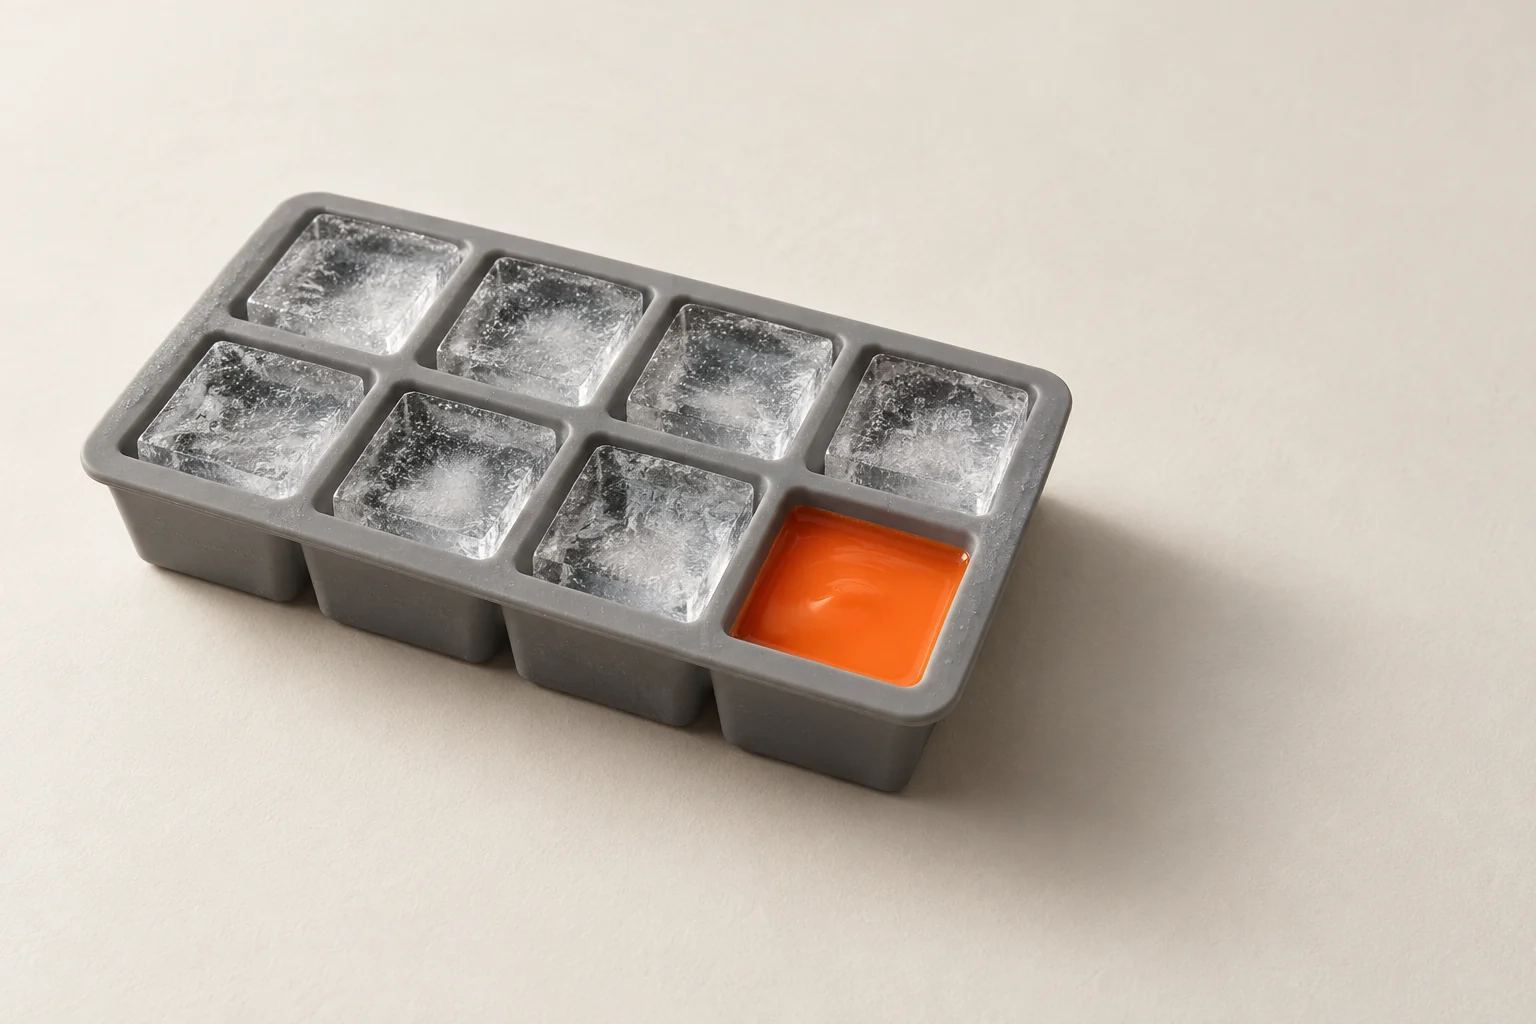
Short shots and sink marks caught before ejection in a modeled plastics scenario.
Read more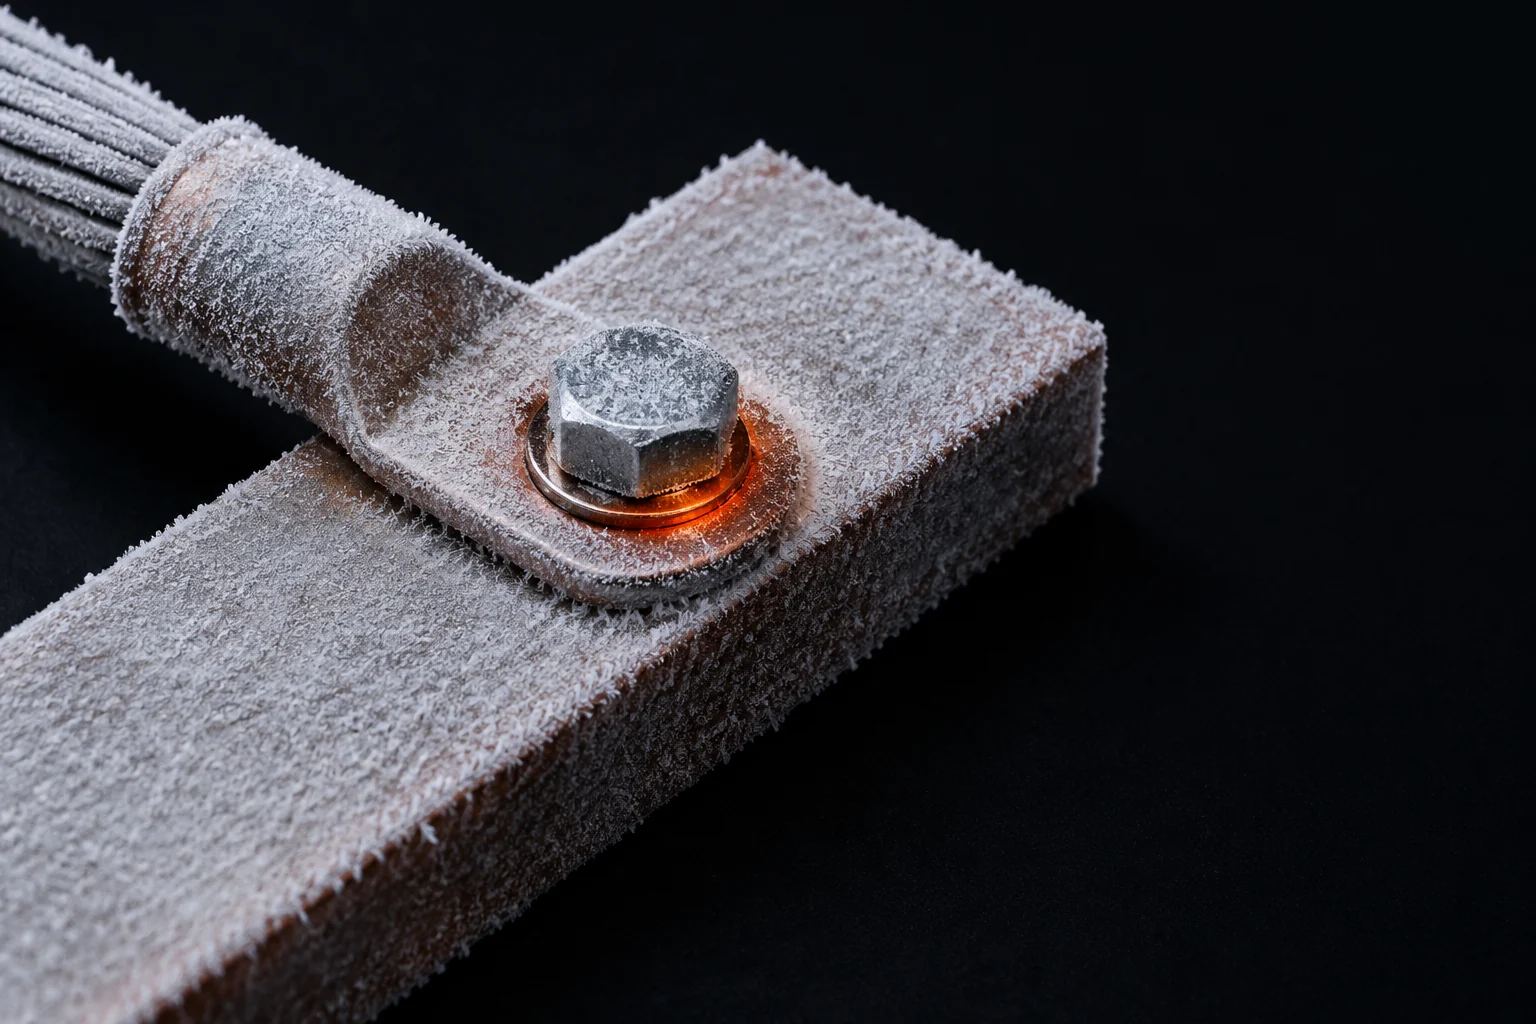
Connection faults flagged weeks before a periodic survey, in a modeled critical-power scenario.
Read more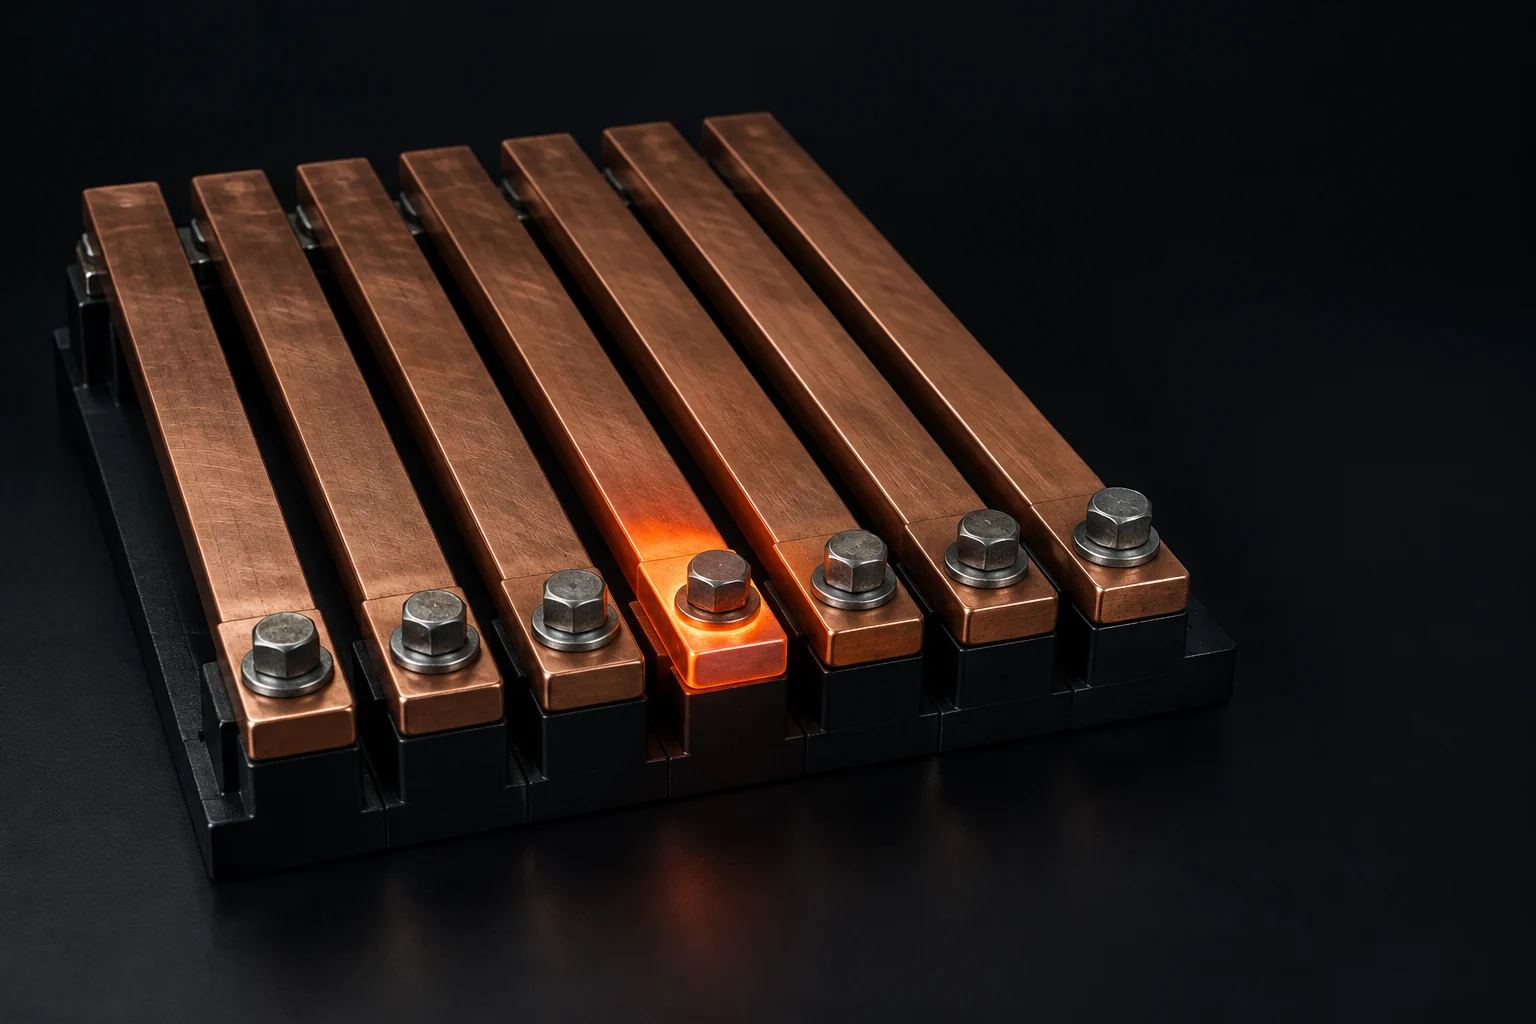
Medium-voltage gear, UPS rooms and battery containers that must never fail quietly.
Read more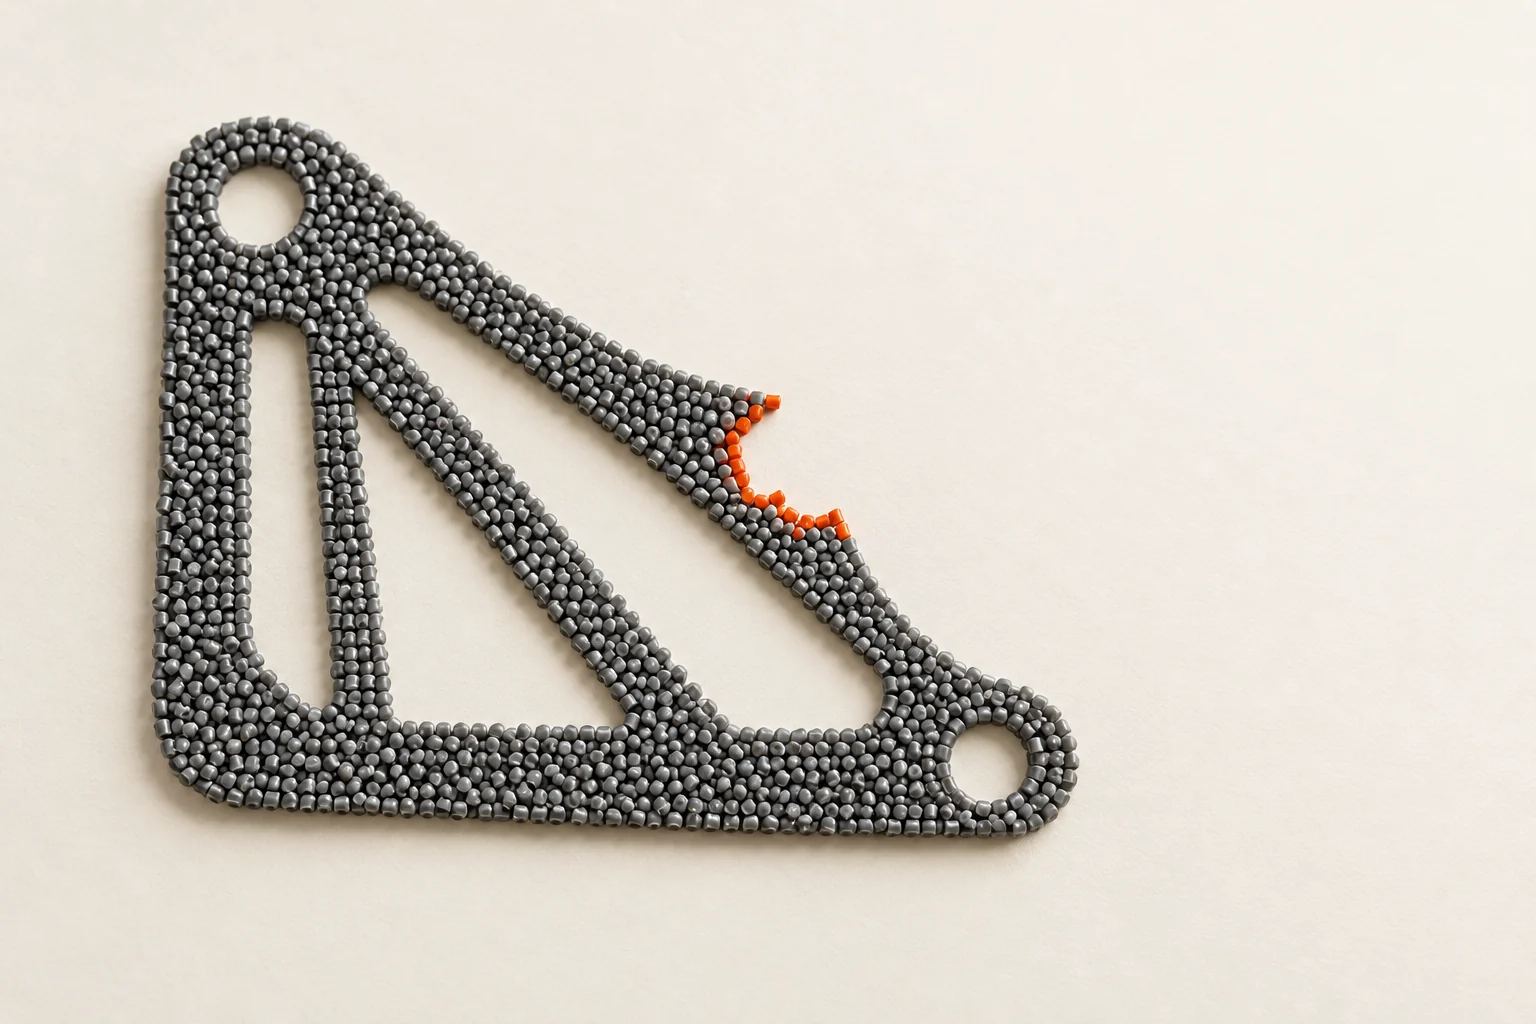
Cavity balance and cooling problems seen in heat before they become scrap.
Read moreFAQ
For the assets they watch, they see far more than a survey. Your insurer or maintenance program may still require periodic surveys, so we treat continuous monitoring as an addition on critical equipment, not a replacement.
Our preferred design views through IR windows fitted to panel covers during a planned outage, so the sensor stays outside. Mounting inside a compartment is considered only where clearances, temperatures and your electrical engineer allow.
Lensnode T is specified at ±2 °C or ±2% of reading. In practice emissivity and reflections matter more than sensor accuracy, which is why alarms are based on temperature rise and phase-to-phase comparison rather than a single absolute number.
Materials with similar color but different chemistry reflect near-infrared light differently. Lensnode M's 8 bands reach 1,000 nm, which helps separate plastics, stones or shell from good product. Our note on hyperspectral foreign-material detection explains the limits.
No. Analysis runs on the Gatepoint and the Console runs on-premise. Substation and outdoor sites can run on a Gatepoint XT with no internet connection at all.
On a discovery call we'll go through your process or your single-line diagram and show where continuous thermal beats a survey, and where it doesn't.