Normalized for load
Each connection's rise over ambient is compared with current from the EPMS meters. A joint heating faster than its load explains is flagged, even while still cool.
Example engagement
A representative data center campus where one infrared survey a year was the only thermal check on its medium-voltage gear and battery containers. Fixed Lensnode T cameras would watch every critical connection, every minute.
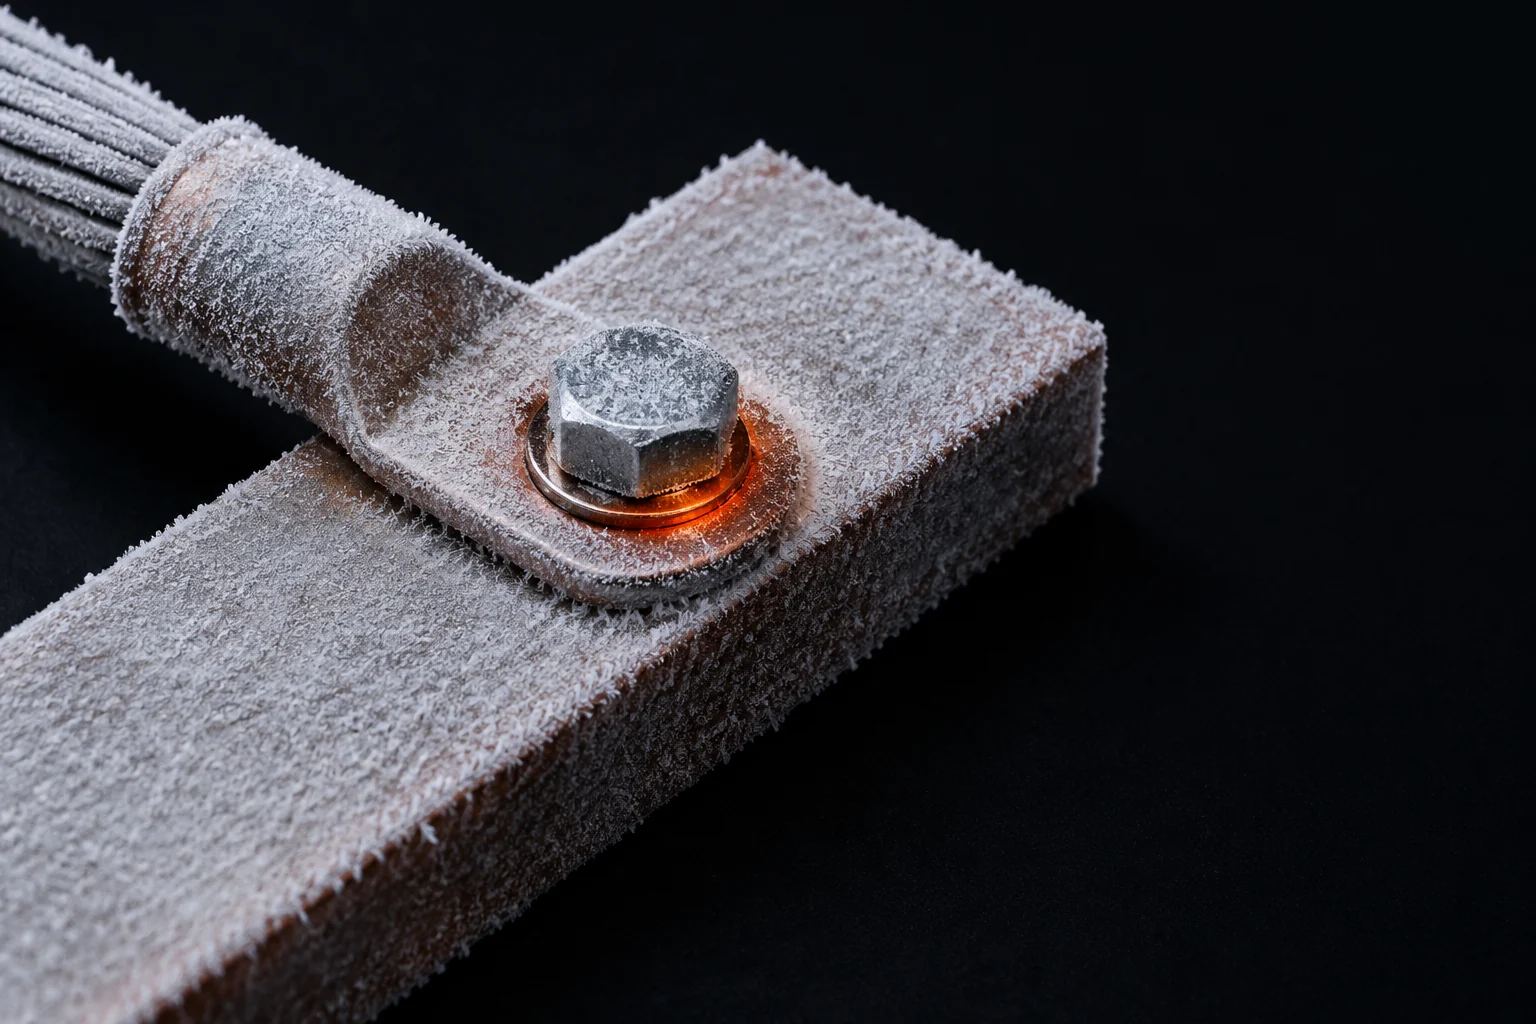
Example engagement — a representative scenario built from typical deployment parameters. Figures are modeled, not reported results from a named client.
Modeled results
earlier warning of a degrading connection than the next periodic IR survey (modeled)
between readings of every monitored connection
thermal coverage, instead of one survey day a year
The situation
Picture a data center campus fed at medium voltage, with two switchgear lineups, an A side and a B side, so that either can carry the critical load while the other is maintained. Beside the building, a battery energy storage system (BESS) sits in four containers.
The maintenance program is sound by most standards. Once a year a qualified thermographer surveys the switchgear through infrared windows in the covers, and the battery containers from inside.
The trouble is physics. A loose or corroding bolted connection heats in proportion to the square of the current through it. In a 2N design each side usually carries well under half its rating, so a joint that would run alarmingly hot at full load shows only a modest rise on survey day: at 40% load it produces just 16% of its full-load heat. And the survey sees one day. A connection that starts to degrade the week after the thermographer leaves has most of a year to get worse.
Constraints
Approach
For electrical assets the Sprint is a site study, not a box of samples: single-line diagrams, recent survey reports, IR-window positions and a year of EPMS load data. We map what each camera can see through a window. Window material attenuates infrared, so readings are corrected for transmission and trends outweigh absolute values. Exit: a camera map and a go.
Loaner cameras on the B side's existing windows and in one battery container. Success criteria, agreed in writing: every termination in view read every minute, readings within an agreed tolerance of the site thermographer's handheld check through the same windows, and alarms visible in the EPMS.
Additional IR windows and camera brackets go in during the two planned maintenance windows, B side first. Alarm and trend points are mapped to the EPMS over Modbus TCP, and every device is hardened, documented and delivered with an SBOM under Edge & OT Security.
A Perflens analyst verifies each thermal alarm within 4 hours on business days, while site technicians see alarms immediately, around the clock. Load-normalized baselines are refreshed quarterly.
What the system does
Each connection's rise over ambient is compared with current from the EPMS meters. A joint heating faster than its load explains is flagged, even while still cool.
The same termination on phases A, B and C, under the same current, should look alike. A growing difference between phases, the thermographer's oldest test, is checked every minute.
A Lensnode T in each container watches DC bus connections and HVAC discharge air, alongside the battery management system and gas detection, not instead of them.
Alarm and trend points reach the existing EPMS over Modbus TCP, so thermal alarms appear beside breaker status, not on another screen.
Gatepoint XT is rated from −40 to 70 °C, so it lives in a sealed enclosure at the yard and buffers readings locally if its network link drops.
Each switchgear side reports to its own gateway, mirroring the site's redundancy, so a fault in one side's monitoring never blinds the other.
Modeled results
earlier warning of a degrading bolted connection than a periodic IR survey
of full-load heat that a faulty joint produces at 40% load, which is why survey days miss it
between readings of each of the 24 camera views
Modeled for two medium-voltage lineups in a 2N arrangement, each side carrying 30–45% of its rating, plus four BESS containers. The modeled fault is a bolted connection whose resistance rises steadily over about four months. Earlier warning compares the continuous system's load-normalized alarm with the first day a survey at typical load could have shown the joint above the site's thermography action threshold. Faults that develop in hours, such as a sudden mechanical failure, are outside this comparison.
Phase two
Related services
Fixed radiometric cameras on switchgear, busbars, BESS containers and substations, trended against load.
Read more
Hardening, network segmentation, SBOMs and signed updates for devices that sit on critical networks.
Read more
Thermal, electrical and environmental monitoring for sites where an outage is never an option.
Read moreFAQ
No. Fixed cameras watch the connections chosen at design time; a thermographer sees the whole room, including things nobody expected to fail. Continuous monitoring changes the eleven months between surveys, and how much the thermographer knows walking in.
Not in this scenario. The cameras sit outside, looking through IR windows rated for the gear, so nothing new is installed inside an energized compartment and no clearances change.
No. Cameras, gateways and Perflens Console run on the site's isolated EPMS network. Analyst verification uses an outbound link the site opens and can close at any time; with it closed, monitoring and EPMS alarms carry on locally.
Start with a single-line diagram and your last survey report. A Feasibility Sprint returns a camera map, a coverage estimate and a written go/no-go in three weeks.